For just over a year now we have been collecting and publishing the species lists collated at the end of walks, forays and meetings on our website. We also include pictures from the walks and of the mushrooms. One of the reasons we do this is so that members have a idea of what species are currently fruiting and for newcomers so that they can see what the species look like. One of the complaints that I head about mushroom clubs when I was just starting out was that people collected the mushrooms, argued over the names and then threw them away at the end of the walk. I would like to think that we have moved on from that what with the species lists and DNA barcoding project. In fact the WPMC has been collecting and publishing lists of the species since its inception but last year is one of the more complete years. These lists should be very interesting to the Park Rangers and managers of the local parks and forests as they give an indication to the diversity of the environments. I thought it would be interesting to go beyond the lists and analyze the data from the whole year.
My background is in the biological sciences but I haven’t studied “Biology” or Mycology professionally. This means that the last time I carried out a field trip and analyzed the data was in middle school. However science is science and I can still muddle through and use some of the analysis techniques I know to pull something together from the lists. I wrote a little software script to go through the lists and create some tables from the data. The first thing I did was to tally how many each species were recorded. In total 331 different species were mentioned in the lists. I know that more species were found over the year that did not make it on the lists either because they were not found on one of the official walks or were not formally identified at the end of a walk. For example there are many species of Russula in the area but quite a few look very similar and can only be identified with the use of a microscope, chemical stains and other tools so they go unidentified at the end of the walk.
Moving on the next thing I did was to tally the frequency of the identifications and plot them in a table.

There were a total of 33 lists collated throughout the year. Two species, [icon style=”camera”] Trametes versicolor (true turkey-tail), and [icon style=”camera”] Stereum ostrea (false turkey-tail), had been observed 20 or more times during the year. About half the species had only been observed once during the year.
It was also easy to plot a graph with the number of species reported by date through out the year.

The season starts of slow and then picked up with a very wet spring and early summer. When the rains stopped in mid July the number of species quickly dropped off too. An outlier during this period was the walk in Dark Hollow Woods which due to the nature of the location was nice and damp resulting one more species observed. One thing we know is that the more people who participate in a walk the more species we find. The two high points in September were from the Lincoff foray in Cook Forest State Park and North Park.
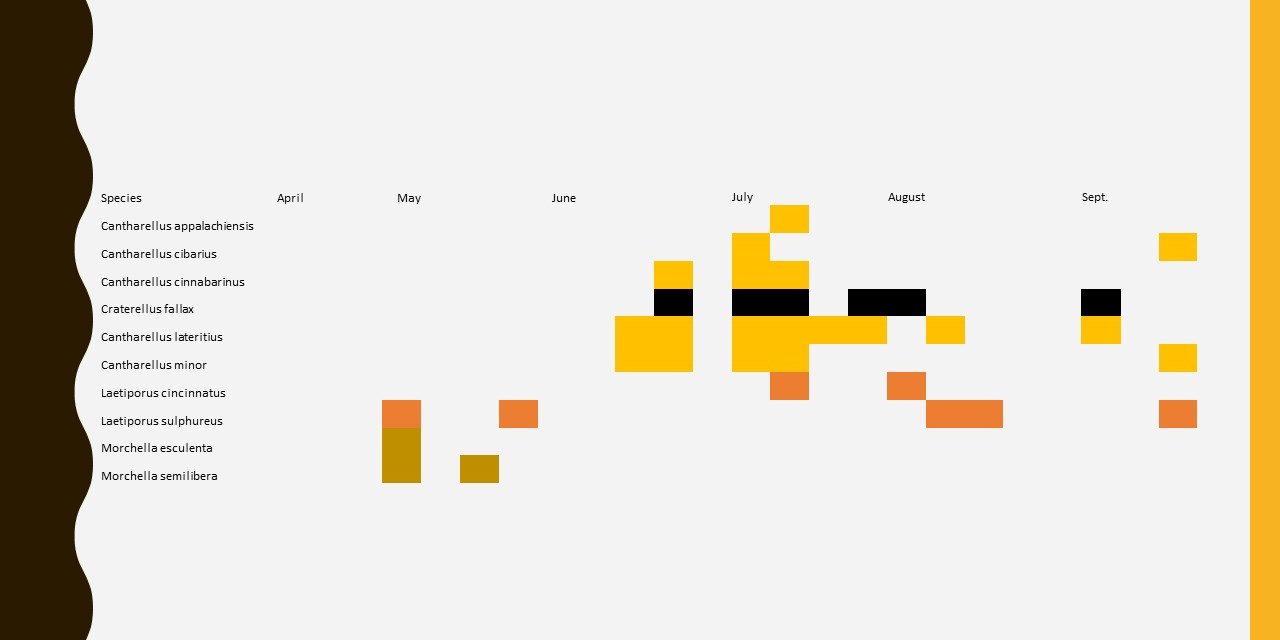
So far so good. Next I wanted to see when the species were observed through the year. This required creating a matrix with the species by date. This is fairly easy to do with a computer program but would be very time consuming by hand. After a bit of data juggling this is what I had:

The black or colored blocks show when a species was observed during the year. The main table is too large to easily read so I pulled out some of the choice edibles into a smaller table:

From this we can see a short Morel season in the early spring. Chanterelles during the summer, normal Chicken of the woods in the spring and autumn and the [icon style=”camera”] Laetiporus cincinnatus variant mainly in the summer. The Morel season was a little longer than shown as we did not record all the species from some of the early season walks and the Chanterelle season was shorter than the table implies as many of the later recording were of dried up specimens. We did find fresh Chanterelles in August and September but not is significant numbers.
When you combine the species list data over multiple years you can start to sort out the fruiting seasons of the different species. You can also see how simple record keeping and lists of observations can be used to can learn more about the the local species found in our parks and forests.
None of this analysis would have been possible without help of the walk leaders, the attendees and collectors and more importantly the identifiers and guest and club mycologists all who have volunteered their time to collect, identify and record the different species over the year. The walks in 2015 were organized by La Monte Yarroll and John Plischke III. I hope that we will be able to a similar number of species lists over the coming year.
Thank you Richard for another job well done. Your efforts and those of the club do not go unnoticed— thank you all. The guest list is truly wonderful, just goes to show how much these folks love what they do! The crazy spring had me tossed for a little bit of a loop this year— but as you imply, nature will do is own thing– on it’s own course. We must all adjust for climatic changes. As Roger Lathem and my dad used to say— Expect to see them, when you least expect to see them! All things in nature run in cycles, not just el-nino! Your apple tree does not produce a bumper crop yearly, nor anything else in nature. You are of a gifted few who notice, and care!!! Did you see more mutants this season? Your friend at lock 8, J.D.