Last year we presented an overview of the species identified at the different parks. This year we have gone one further in the visualization of the species lists. The new analysis includes data back to 2012 and we plan to add all of our historical records over time. We will also add new data analysis to the visualization so you can consider this a work in progress. The analysis page is now available all year round here.
Quick overview of the data
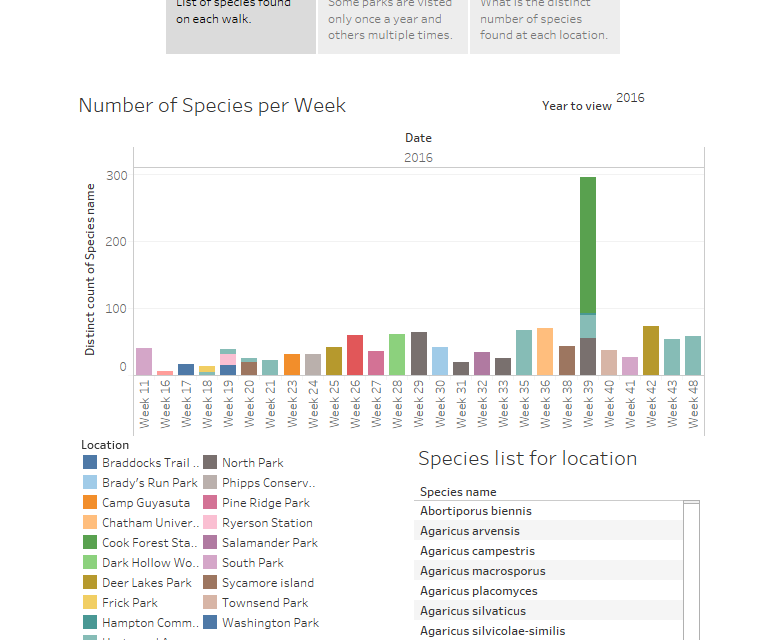
The analysis is split over three views. The first view is of a table with the number of species observations per walk. See the main picture above. In the actual analysis you can click on one of the bars to see the species list from the walk. You can also change the year that you are viewing.
This year there was a slow start until about week 22, the end of May. Then the warmth arrives and fungi diversity increases until mid July when it started to dry out and the number of species found drops. This year there was some substantial rain in August and the number of species found on each walk increased. The weather was then dry through to October and we had the second lowest number of species identified at the Lincoff foray in North park. Further north in Cook Forest State Park conditions were perfect and we found a lot of species. From mid October onward the weather was wet and warm for the time of year and we have found plenty of species on these late season walks.

The second view is of a map with the number of observations by location. Again the view is initialized to show the 2016 data but you can expand it out to all years if you wish. Some locations were visited multiple times, like Hartwood Acres, so there area lot of observations from the site. The two foray sites, North Park and Cook Forest State Park, also have a lot of observations. Double click on the map to zoom in and click on a location to see the list of species from that area.
The final view is very similar to the second view except instead of plotting the number of observations we are plotting the number of distinct species per location. You can also filter the locations by one or more species of interest. For example click on the species and uncheck the uncheck “All” option then select a species to see where it has been found.
This analysis only represents a snap shot of the fungal diversity in our local parks and forests. Many of the park environments around Pittsburgh are very similar and we can expect to find similar numbers of species if we were to make enough observations over a year. As the old data is uploaded, and as we make more observations, the number of species observed at each location will increase.
If you are interested in what we have found this year please explore the analysis. If you have any suggestions on further analysis please contact me with details at [email protected].
Do we have enough data to plot a species sampling curve? I regret that we have not been recording the number of people at each walk to get person-hours, though 15 is a decent guess at an average. We do have records for the attendees at the major forays.
I think we could do a species sampling curve for the Lincoff Foray. We have some records for the number of people who signed in for individual walks but they are incomplete. Would you want to plot the species sampling curve for each individual location? Or the county or the whole area? I guess the whole area as the number of species observed varies depending on the time of year.
I do not have anymore data that what is available on the website for previous years and I don’t know how much data we need to begin to plot a species sampling curve. Any idea?
Would it be of interest to look at the number of species by temp and rain within a period of time. There should be some public weather data which I can explore. As for the number of people it may useful to examine within site. I will look into sampling curve methods.
We know that weather is one of the factors that effects the number of species observed. I am not sure how well it will correlate because we sample a different site every week with a different number of people. This means that the number of species observed will often be lower with less people out walking and some sites have more mushroom friendly terrain and we find more species in those locations. Possible that averaging over a few years will even out some of those differences? A well sampled location like Hartwood Acres shows a big drop in the no. species observed during the drier summer months. I think it is worth trying and see what the results look like.